
This analysis used data from 8,811 respondents ages 18–49 in the CDC’s 2022–2023 National Survey of Family Growth. Respondents reported how often a parent or other adult had hit, beaten, or physically hurt them before age 18. Lifetime cigarette smoking was defined as having smoked at least 100 cigarettes, regardless of current smoking status.
Findings
The weighted percentages showed progressively higher lifetime smoking prevalence with more frequent reported childhood physical abuse. Among men, prevalence increased from approximately 28% for those reporting “Never” to 47% for those reporting “Always.” Among women, it increased from 17% to 53%. Men had higher percentages in every category except “Always.”
A two-way ANOVA using unweighted data found significant main effects for sex, F(1, 8801) = 9.40, p = .002, and abuse frequency, F(4, 8801) = 40.18, p < .001. The sex-by-abuse interaction was not significant, F(4, 8801) = 0.85, p = .496. Thus, the apparent crossover at the highest abuse frequency was not supported by a statistically significant interaction. That category included only 34 men and 79 women. The model explained approximately 3.3% of the variation in smoking status.
The abuse/smoking association might reflect generational differences, with older respondents having experienced more physical punishment and being more likely to have smoked. To examine this possibility, age was added as a covariate in the unweighted analysis. Reported childhood physical abuse remained significantly associated with lifetime cigarette smoking after controlling for age and sex, F(4, 8800) = 34.47, p < .001. Age was also significant, F(1, 8800) = 444.34, p < .001. Thus, the association was not fully explained by the linear age adjustment used in this model, although other confounding factors could still contribute and the results do not establish causation.
Interpretation and Limitations
These results describe an association, not evidence that childhood physical abuse causes smoking. Age, childhood socioeconomic conditions, parental education, and parental smoking are possible alternative or contributing explanations that were not examined. The measures also rely on respondents’ recollections.
The chart presents survey-weighted percentages, whereas the ANOVA did not incorporate survey weights, strata, or clusters. Its significance tests should therefore be treated as exploratory rather than design-adjusted population tests. ANOVA also provides an approximation for this binary outcome.
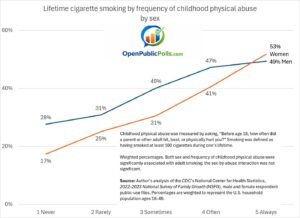
Source: Author’s analysis of the National Center for Health Statistics, 2022–2023 National Survey of Family Growth, male and female respondent public-use files.