Regional Differences in Relationship Satisfaction Across the United States
Jonathan Rich, PhD
jrich@psychologicaltesting.com
Abstract
This exploratory study examined whether relationship satisfaction differed across U.S. Census regions among adults in committed relationships. Participants (N = 244) were recruited online using a convenience sampling method and included individuals age 18 and older who were married or in a long-term committed relationship. Relationship satisfaction was rated on a 7-point scale ranging from 1 (Very dissatisfied) to 7 (Very satisfied). A one-way analysis of variance (ANOVA) revealed statistically significant regional differences in relationship satisfaction, F(8, 215) = 5.86, p < .001, with a moderate effect size (η² = .179). The highest levels of satisfaction were observed in New England and Pacific regions, whereas lower levels were observed in portions of the South and Middle Atlantic regions. Results should be interpreted cautiously due to the use of a non-random convenience sample and unequal regional representation.
Introduction
Relationship satisfaction has long been associated with psychological well-being, physical health, and life satisfaction. Cultural norms, economic conditions, regional values, and lifestyle differences may influence how individuals experience and evaluate romantic relationships. The present exploratory study investigated whether average relationship satisfaction differs across U.S. Census regions.
Method
Participants
Participants consisted of 214 adults recruited online. Eligibility criteria required participants to be at least 18 years old and either married or involved in a long-term committed relationship. The sample represented a convenience sample and was not intended to be nationally representative. Mean age was 30.6, ranging from 20 to 61. There were 73 men, 151 women. A same-sex partner was reported by 10.3% of the sample, 91.1% were married.
Measure
Participants rated their overall relationship satisfaction on a 7-point Likert-type scale:
1 = Very dissatisfied
7 = Very satisfied
Procedure
Participants completed an online survey that included demographic questions and the relationship satisfaction item. Respondents were grouped into the nine standard U.S. Census regions.
Statistical Analysis
A one-way ANOVA was conducted to examine whether mean relationship satisfaction differed across regions.
Results
The ANOVA demonstrated statistically significant differences in relationship satisfaction across regions:
- F(8, 215) = 5.858, p < .001
- Eta squared (η²) = .179
The effect size indicates that approximately 18% of the variance in relationship satisfaction scores was associated with Census region membership, representing a moderate effect.
Regional Means
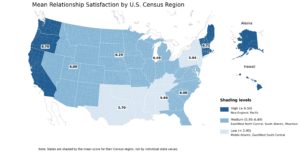
The highest mean relationship satisfaction scores were found in:
- New England: 6.71
- Pacific: 6.70
The lowest scores were found in:
- East South Central: 5.60
- West South Central: 5.70
- Middle Atlantic: 5.94
Most regional averages fell above the midpoint of the scale, indicating generally positive relationship satisfaction across the sample.
Figure 1.
Discussion
The findings suggest that relationship satisfaction may vary meaningfully across U.S. regions. Participants from New England and Pacific states reported the highest satisfaction, while some Southern and Middle Atlantic regions reported somewhat lower average satisfaction.
Several factors could potentially contribute to these regional differences, including cultural expectations regarding relationships, educational differences, socioeconomic conditions, political climate, urbanization, stress levels, or differing attitudes toward emotional expression and marriage. However, the present study was not designed to determine causation.
An important contextual observation is that relationship satisfaction was generally high throughout the sample. Over 99% of participants rated themselves at or above the midpoint of the scale, suggesting that even lower-scoring regions still reflected relatively positive relationships overall.
Limitations
This study has several important limitations:
- The sample was a convenience sample recruited online rather than a probability sample.
- Regional subgroup sizes may have varied substantially.
- Self-report data are subject to response bias and social desirability effects.
- The cross-sectional design prevents causal conclusions.
- Demographic variables such as age, income, education, and relationship duration were not controlled in this analysis.
Because of these limitations, the findings should be viewed as exploratory rather than definitive.
Conclusion
This exploratory analysis found statistically significant regional differences in relationship satisfaction among adults in committed relationships across the United States. Although overall satisfaction levels were generally high nationwide, notable regional variation emerged. Future research using larger and more representative samples could help clarify the social, cultural, and demographic factors contributing to these patterns.