
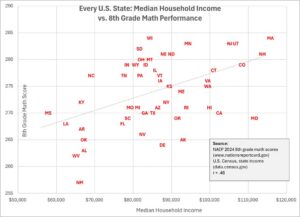
The figure below compares median household income with average eighth-grade mathematics scores for all 50 U.S. states in 2024.
Overall, wealthier states tended to have higher math scores. The relationship was moderate in strength (r = .48), indicating that approximately 23% of the variation in state math performance was associated with differences in median household income. While the trend was clearly positive, household income alone was far from a complete explanation of student achievement.
Several states stood out from the overall pattern. Massachusetts combined one of the nation’s highest median household incomes with the highest eighth-grade math performance. Other Upper Midwest and New England states, including Minnesota, Wisconsin, South Dakota, Nebraska, and New Hampshire, also performed better than many states with comparable incomes.
Conversely, several relatively affluent states scored lower than expected based on income alone. Maryland and California, for example, reported high median household incomes but more modest average math scores. At the other end of the spectrum, Mississippi performed somewhat better than its income level might predict, while New Mexico recorded the lowest average math score among the states included.
The results suggest that economic prosperity and educational performance are related, but they also illustrate that other factors—including educational policies, demographics, school quality, and social conditions—likely contribute to differences in student achievement across states.
Data Sources
National Assessment of Educational Progress (NAEP), 2024 Grade 8 Mathematics Assessment.https://nces.ed.gov/nationsreportcard/state/
U.S. Census Bureau, 2024 Median Household Income Estimates. https://data.census.gov/table/ACSDT1Y2024.B19013